Read data before declaring success
Interpret a small illustrative dataset without overclaiming.
2.0 minutes · English captions · Transcript + illustrated learning notes
This lesson has required companion reading below, including material not spoken in the video. Complete it before the assessment.
English captions available in the video player.
Narration and visual explanations
This transcript represents the recorded lesson using conventional written abbreviations and numerals. Open View technical information to see each diagram and its explanation. This lesson has required companion reading below, including material not spoken in the video. Complete it before the assessment.
A deliberately small dataset
View technical information · Diagram 1
Lesson explanation
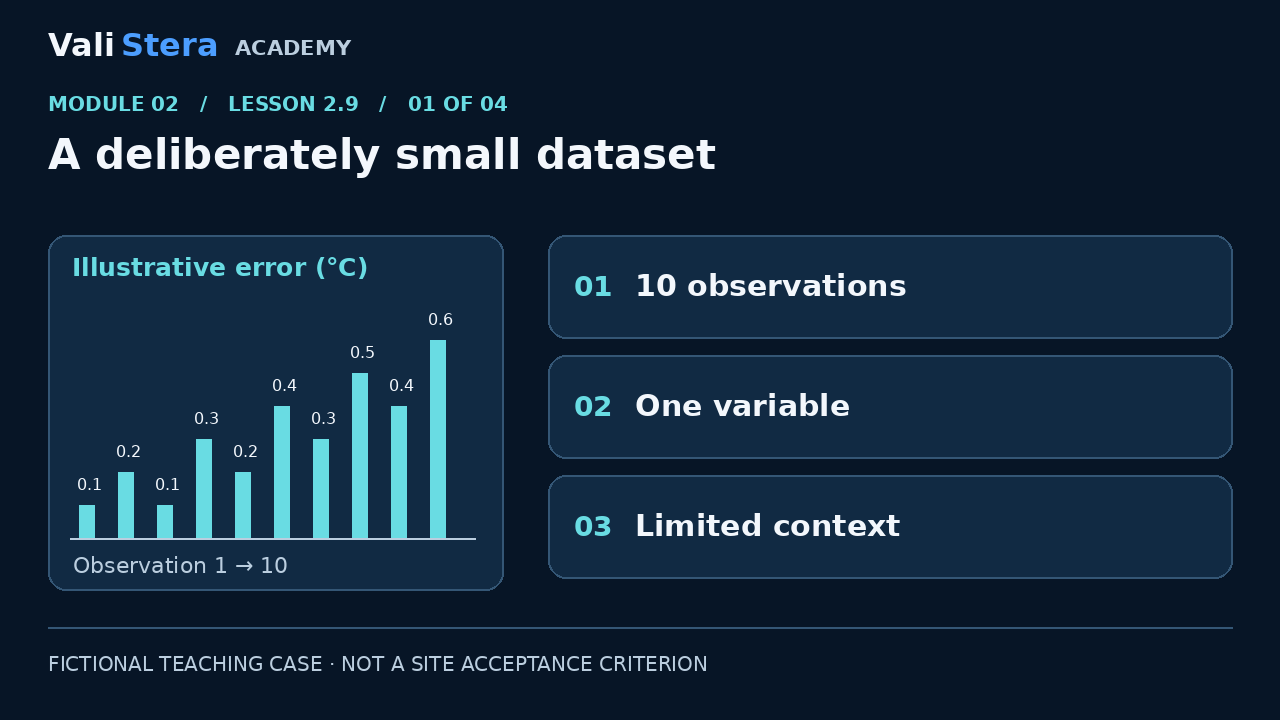
The learning dashboard contains ten fictional temperature-indication errors in degrees Celsius: 0.1, 0.2, 0.1, 0.3, 0.2, 0.4, 0.3, 0.5, 0.4 and 0.6. They illustrate a time-ordered pattern. They are not calibration data from a real instrument and do not define a pharmaceutical tolerance.
Calculate transparently
View technical information · Diagram 2
Lesson explanation
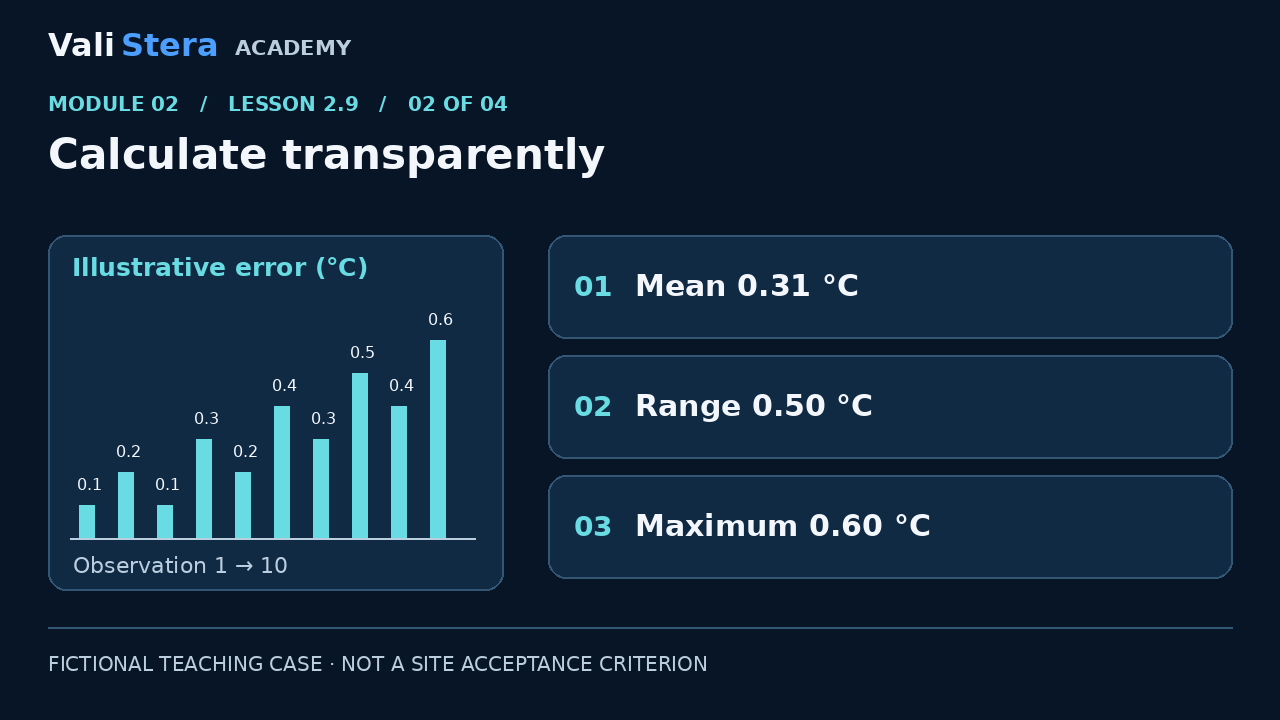
The total is 3.1 °C across ten errors, giving a mean error of 0.31 °C. The range is 0.6 minus 0.1, or 0.5 °C. The highest error is 0.6 °C. The chart includes the underlying values in a table so that learners can check the arithmetic without relying on colour or vision. These summaries describe this small dataset only.
Pass limits are not trend limits
View technical information · Diagram 3
Lesson explanation
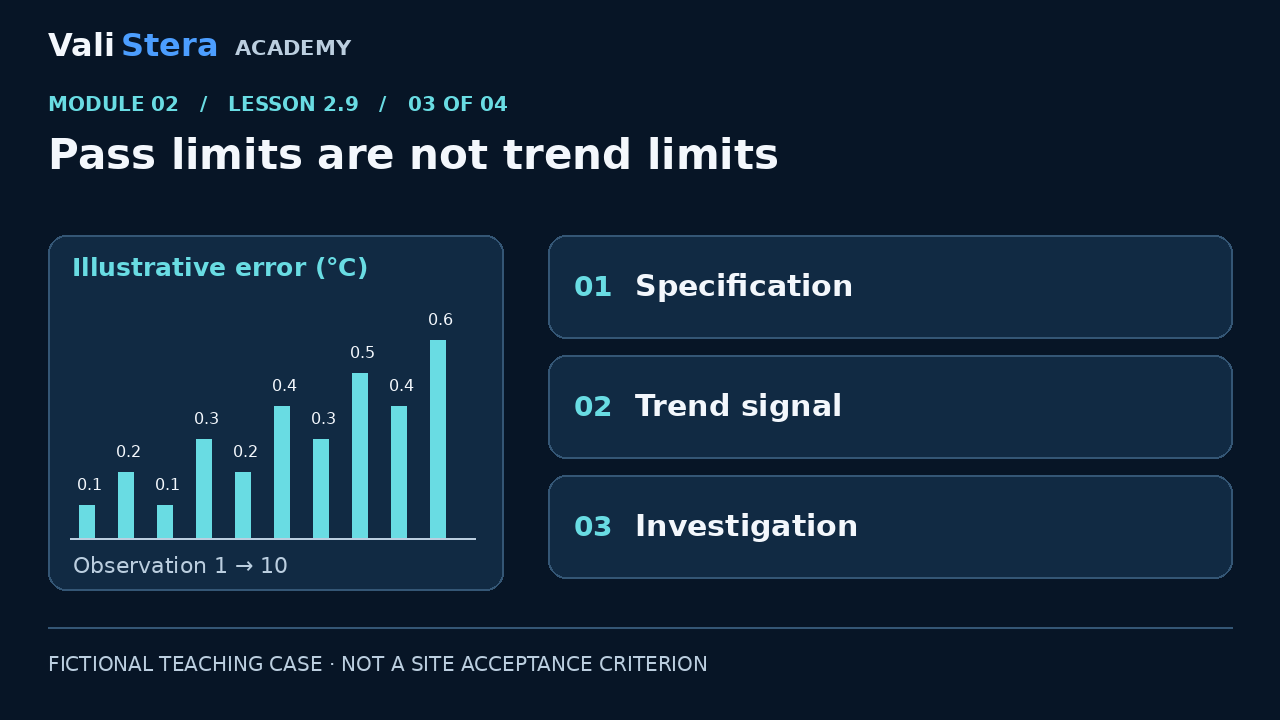
For arithmetic practice only, set an illustrative absolute-error limit of 0.5 °C. Nine of the ten observations meet that example limit and one does not. The limit is not an official criterion and does not qualify an instrument. The upward pattern also deserves attention even before a limit is exceeded. In a real investigation, examine measurement uncertainty, reference suitability, conditions and data integrity before drawing conclusions.
Do not infer capability
View technical information · Diagram 4
Lesson explanation
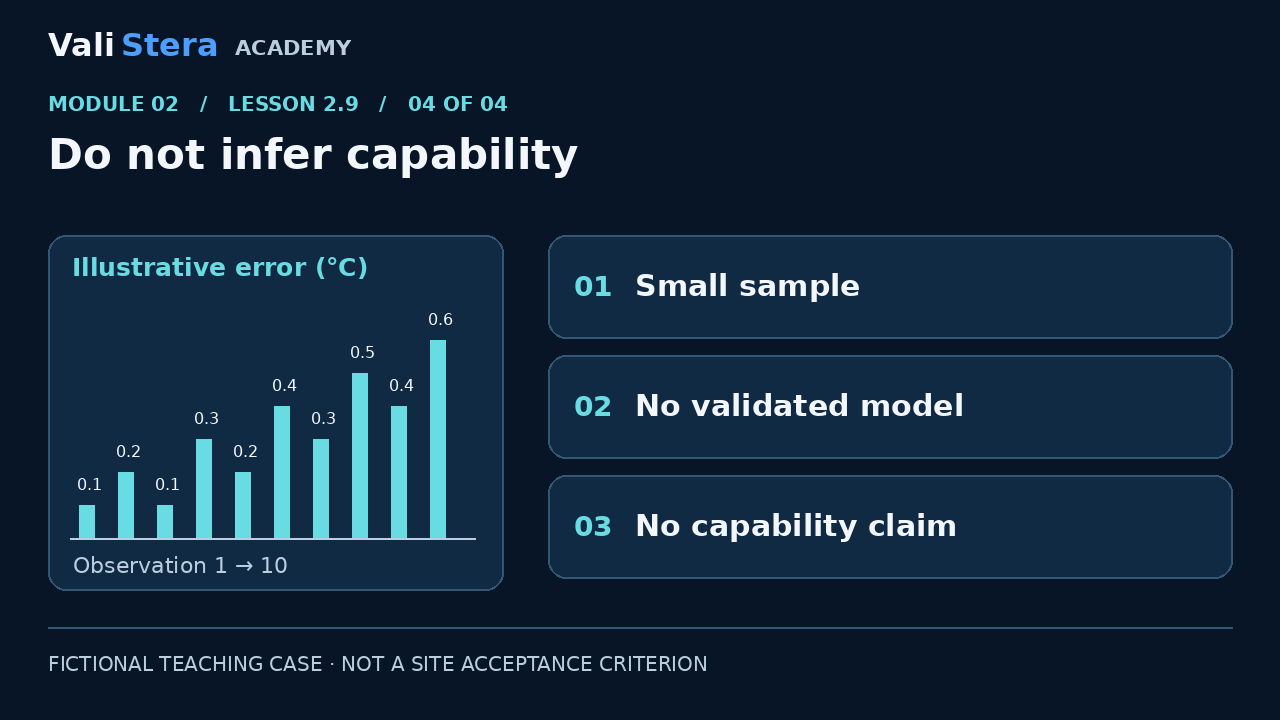
Do not calculate a confident capability claim from these ten convenient values. A meaningful analysis requires a suitable study design and understanding of the measurement system and process behaviour. In the activity, change the illustrative limit, observe the count and explain what information is still missing. More green points do not create more knowledge. The purpose is to practice transparent calculation and proportionate interpretation, not to approve a system.
Required reading: signed and absolute error
Each listed value is signed error: indication minus reference, in °C. All ten happen to be positive. The decision compares |error| with the illustrative limit; equality passes this numerical comparison. A −0.6 °C error would also exceed a 0.5 °C absolute limit.
The signed mean is +0.31 °C; range is 0.50 °C. Four absolute errors exceed 0.30 °C; one exceeds 0.50 °C. Measurement uncertainty and an approved decision rule are still needed for real conformity decisions. Ten observations do not establish capability or stability.
Explore the fictional data
Signed temperature indication error (indication minus reference, °C), observations in time order. The count uses absolute magnitude; all supplied values are positive. No site data or official tolerance is represented.
| Observation | Error (°C) |
|---|---|
| 1 | 0.1 |
| 2 | 0.2 |
| 3 | 0.1 |
| 4 | 0.3 |
| 5 | 0.2 |
| 6 | 0.4 |
| 7 | 0.3 |
| 8 | 0.5 |
| 9 | 0.4 |
| 10 | 0.6 |
Mean 0.31 °C · Range 0.50 °C · 1 of 10 above 0.50 °C.
Changing this example limit changes only the count. It does not establish calibration, stability, capability or qualification.
Apply it · Activity 9
Calculate the mean and range, count results above 0.5 °C, and list four missing inputs before a real decision.
Compare with model reasoning
Mean 0.31 °C; range 0.50 °C; one value exceeds 0.5 °C. Missing inputs include justified acceptance criteria, reference/measurement uncertainty, operating conditions and representative study design.